
Hands-on: VisualVM, Java Mission Control, JProfiler, YourKit Java Profiler
A major advantage of the Java ecosystem is the wide selection of very good developer tools. You can also quickly find some mature programs in the area of profiling.
I have tried probably the 4 most popular Java profiling programs(VisualVM, Java Mission Control, JProfiler, YourKit Java Profiler) and would like to report on my experiences in this article. The focus is on locally running desktop applications and not on solutions that can be run on a server in the cloud, for example. As the topic is very extensive, the evaluation and conclusion are correspondingly subjective.
Basics
Profiling types
A distinction can be made between different types of profiling.
- CPU profiling: CPU profiling shows where the application uses how much computing time. This metric is usually viewed at a function or method level.
- Memory profiling: Memory profiling shows what uses how much memory. It also provides information on how memory is managed. Keywords here are "memory allocation" and "garbage collection". One aim is also to find so-called "memory leaks".
- Async profiling: Async profiling is about understanding the coordination of processes. One example of this is the interaction of different threads.
- Higher level profiling: Higher level profiling is about monitoring the behavior of technical application functions. For example, the execution of queries against a database (JDBC, JPA, ...), web requests (servlets, ...) or the throwing of exceptions.
- Application profiling: Application profiling is about making the behavior of your own application logic visible. To do this, you often need to implement your own metrics in the application that make sense in context.
Application variants
Depending on the situation, profilers can be used in different ways.
- Attached: A process is started that is prepared (instrumentalized) with the corresponding profiler.
- Local: The profiler establishes a connection to a JVM process that is already running locally.
- Remote: The profiler establishes a connection to a remote process via an appropriate protocol. To do this, the protocol must be set up accordingly on the server side.
- Snapshot: An image of a system is created at a point in time in order to then evaluate the image in detail. As a snapshot only records one point in time, the information it contains can be very detailed. A special snapshot are Java Flight Recorder recordings. The information and metrics are collected by a program over a period of time and stored temporarily in a file. The data can then be analyzed later in a profiler. Especially for resource intensive surveys, it is often a good option to make targeted and short recordings.
Java Mission Control
The Java Mission Control (JMC) is a program based on Eclipse RCP based interface for monitoring and evaluating Java applications. The JMC application used to be part of the commercial JDK package from Oracle. The program is now available under an open source license available. A special feature is that the tool is mainly used for the evaluation of Java Flight Recorder Events which means that various metrics can be mapped very flexibly.
Java Mission Control can be downloaded free of charge from the AdoptOpenJdk website: https://adoptopenjdk.net/jmc.html
As the application is based on Eclipse, there is also an option on the site to integrate the application as a plugin in the Eclipse Java development environment.
| Attached | Local | Remote | Snapshot |
|---|---|---|---|
| JVM option | Yes | JMX | *.hprof, *.jfr, *.persisted_jmx_data |
*.hprof= HProf Snapshots*.jfr= JDK Flight Recordings*.persisted_jmx_data= Persisted JMX Data
Pro:
- Free of charge: The program is now available as open source software and is therefore easily accessible.
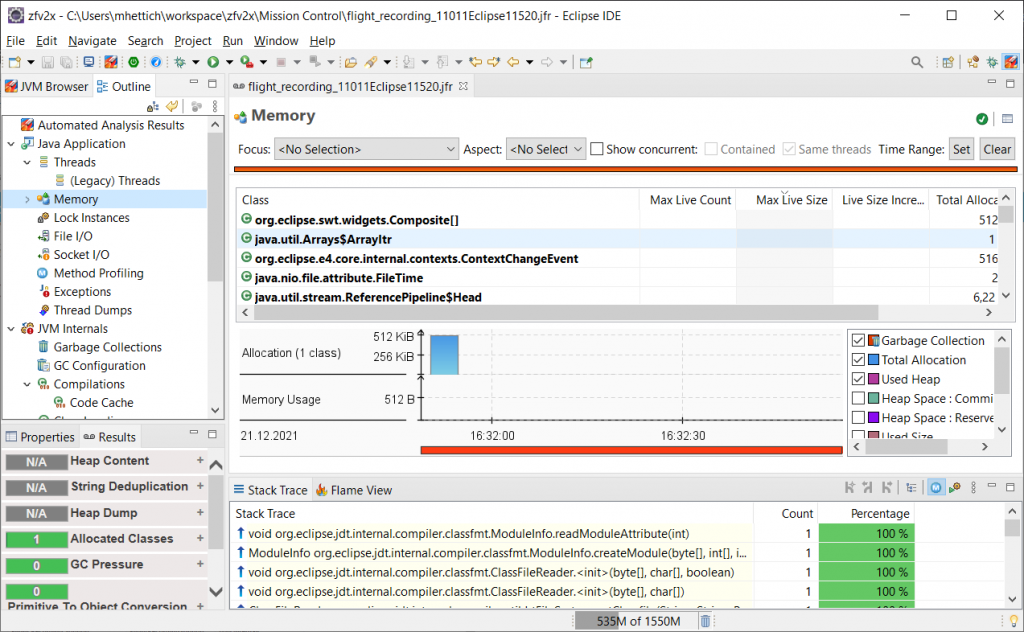
- Eclipse integration: As the application is based on the Eclipse Rich Client Platform, Eclipse IDE users feel right at home. The application can therefore also be integrated directly into the Eclipse IDE as a plugin.
- JFR as a strong basis: The JMC application is based on JFR Events, which are widely supported directly via the JDK. The ecosystem around JFR events continues to grow. Custom metrics can be easily created using the APIs and process them.
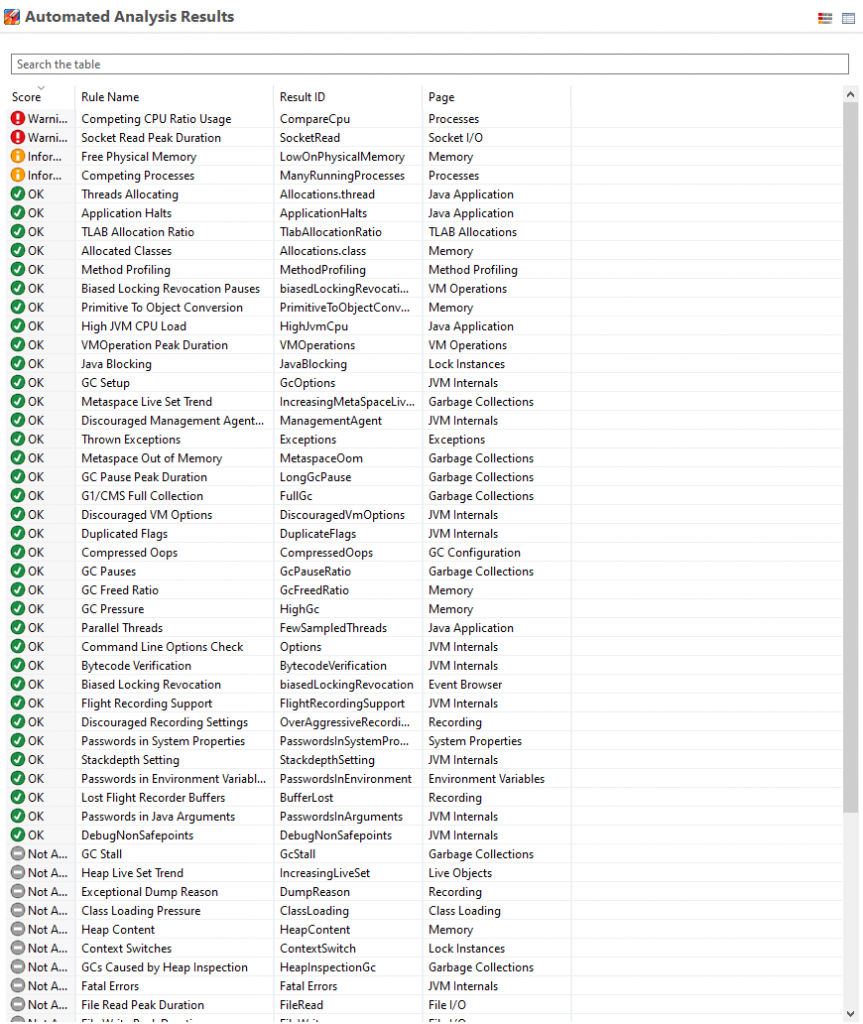
- Automated Analysis Results: The JMC provides automatic evaluations of the metrics and recommendations for action via so-called rules. You can implement your own rules.
Contra:
- Unpopular with Bitdefender: Bitdefender on my company computer didn't like the standalone version of JMC and quarantined it.
- Sometimes too generic, powerful and flexible: The JMC interface is sometimes very generic in order to be able to handle JFR events as flexibly and powerfully as possible. Therefore, the handling sometimes seems a little complicated and convoluted.
Screenshots
Automated Analysis Results
Eclipse IDE Plugin Integration
VisualVM
With VisualVM is a program based on the Netbeans platform platform for monitoring and evaluating Java applications. VisualVM is available as an open source application available. In Java 6 to 8, VisualVM was part of the JDK package. Since Java 9, the program has been available separately.
VisualVM can be downloaded free of charge from the following page: https://visualvm.github.io/download.html
| Attached | Local | Remote | Snapshot |
|---|---|---|---|
| Yes | Yes | jstatd, JMX | *.apps, *.jfr, Core Dumps |
.apps= Application Snapshots*.jfr= JDK Flight Recordings- Core dumps = thread and memory dumps
Pro:
- Free of charge: The program is now available as an open source application and is therefore easily accessible.
- Solid and coherent functions: VisualVM works particularly well in the area of CPU and memory profiling and provides very solid tools.
- JFR Events: Can display basic JFR events from a snapshot.
- Extensions / Plugins: Some extensions, e.g. the MBean Browser, add further solid functions.
Contra:
- Few functions for application profiling or high level profiling: In general, you can certainly view all sorts of things at a generic level via MBeans, for example. However, special functions or presets are missing here.
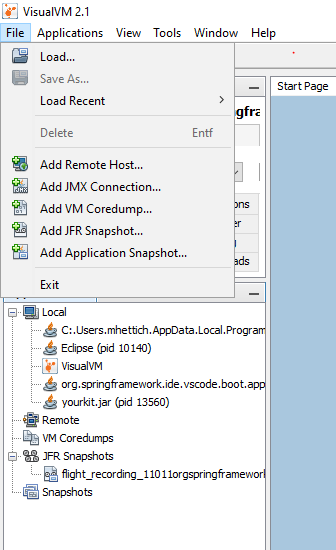
Screenshots
Entry points
JProfiler
The JProfiler is a commercial product from the 2001 founded company ej-technologies with headquarters in Munich.
In addition to paid licenses, the tool for examining and evaluating Java applications can be tested free of charge for a few days. Installation is convenient via an installer, which also allows extensions to be installed directly in common development environments. The program can be downloaded here: https://www.ej-technologies.com/download/jprofiler/files
You can create your own metrics via the JMX/MBean protocol or via so-called probes can be integrated.
| Attached | Local | Remote | Snapshot |
|---|---|---|---|
| Main Class, Jar, Class path, Application Server Integration | Yes | SSH, Profiling Agent | *.jps, *.hprof, *.bin, *.hpz, *.phd, *.jfr |
*.jps= JProfiler snapshots*.hprof,*.bin= HProf Snapshots*.hpz= Compressed HProf Snapshots*.phd= IBM PHD Snapshots*.jfr= JDK Flight Recordings
Pro:
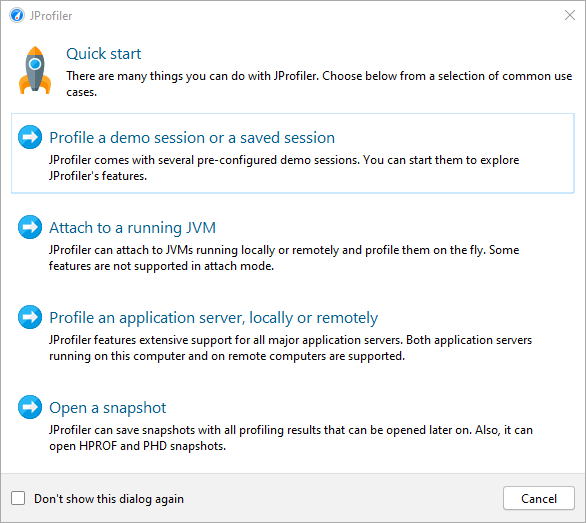
- Clearly arranged: The user interface is clearly laid out. The navigation on the left-hand side takes you directly to the various areas and functions.
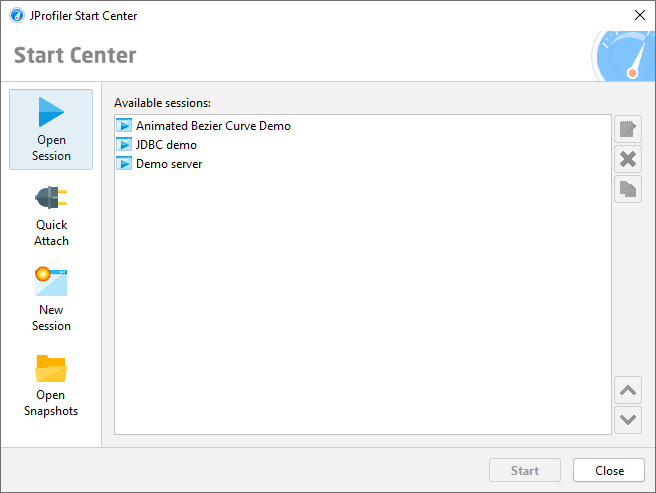
- Demo application: To familiarize yourself with the JProfiler, there is the option to start a demo application directly from the application, which allows you to control the behaviour or load and examine it with the profiler.
- Test the full scope free of charge: A trial license allows you to test JProfiler to its full extent for a few days.
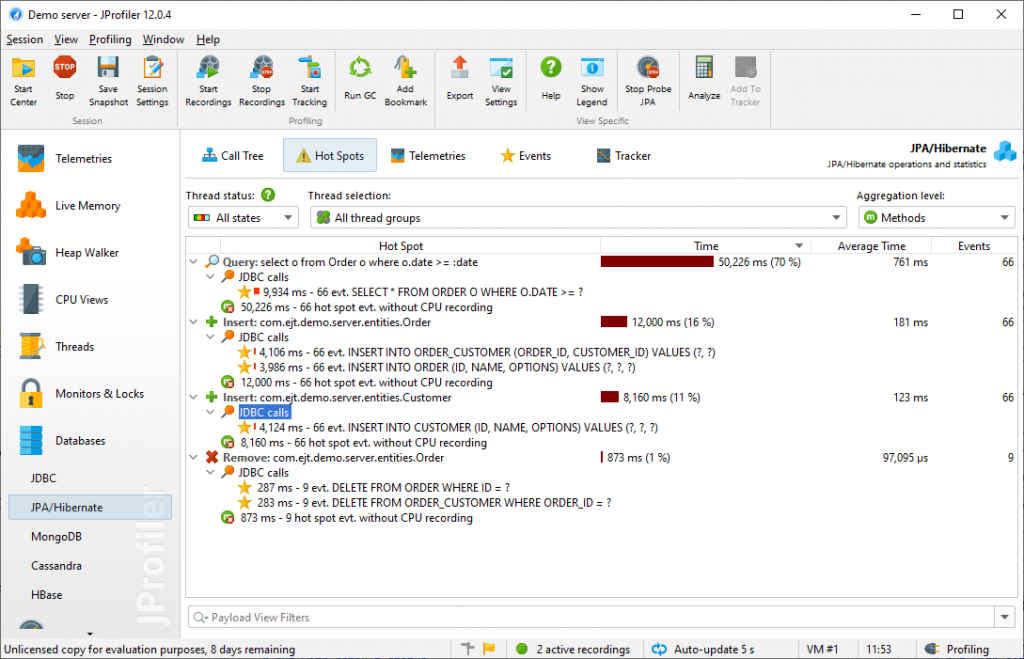
- Database query analysis: The JProfiler understands database queries for some common frameworks and databases out-of-the-box and clearly displays the runtime of the queries. This allows you to quickly identify any bottlenecks. See screenshots.
- JMX/MBean support: Metrics that are already available via JMX or MBeans can be integrated into the JProfiler.
Contra:
- Does not show events in JFR snapshots
- Price: Due to the available (free) alternatives, I don't find the price particularly attractive. Especially basic analyses, such as CPU and memory, are also done relatively well by the free programs.
Screenshots
Entry points
Database profiling
YourKit Java Profiler
The YourKit Java Profiler is a commercial product from the 2003 founded company YourKit with headquarters in Düsseldorf.
In addition to paid licenses, the tool for examining and evaluating Java applications can be tested free of charge for a few days. It can be installed conveniently using an installer, which can be downloaded here: https://www.yourkit.com/java/profiler/download
Extensions for common development environments are available.
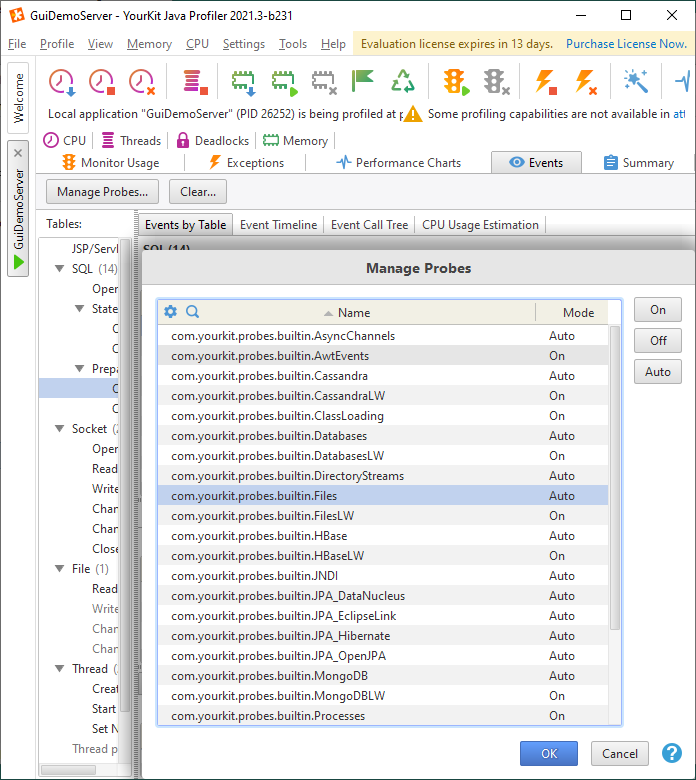
As a basic principle, the profiler uses so-called probes. These are interceptors used to track various aspects of an application. In addition to predefined probes it is also possible to create your own probes with Java.
| Attached | Local | Remote | Snapshot |
|---|---|---|---|
| JVM option, application server integration | Yes | SSH, Profiling Agent | *.snapshot, *.hprof, *.bin, *.phd |
*.snapshot= YourKit Snapshots*.hprof,*.bin= HProf Snapshots*.phd= IBM PHD Snapshots
Pro:
- Also recognizes alternative VMs such as OpenJ9.
- Expandable through the concept of probes.
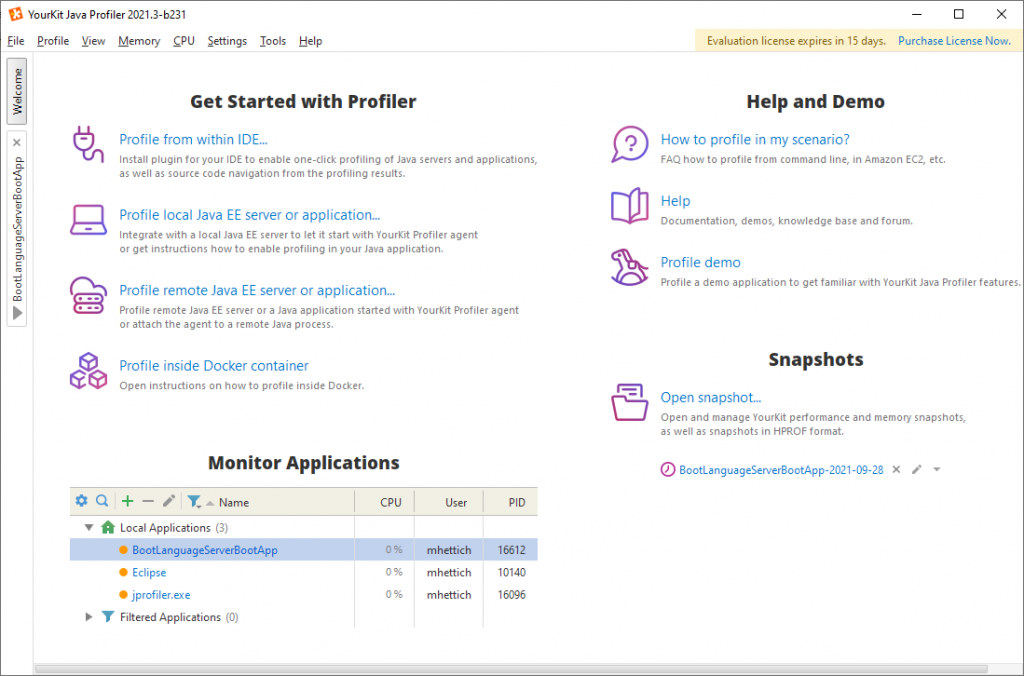
- Demo application: To familiarize yourself with the YourKit Java Profiler, there is the option to start a demo application directly from the application, which allows you to control the behavior or load and examine it with the profiler.
- Test the full scope free of charge: A trial license allows you to test the YourKit Java Profiler for a few days.
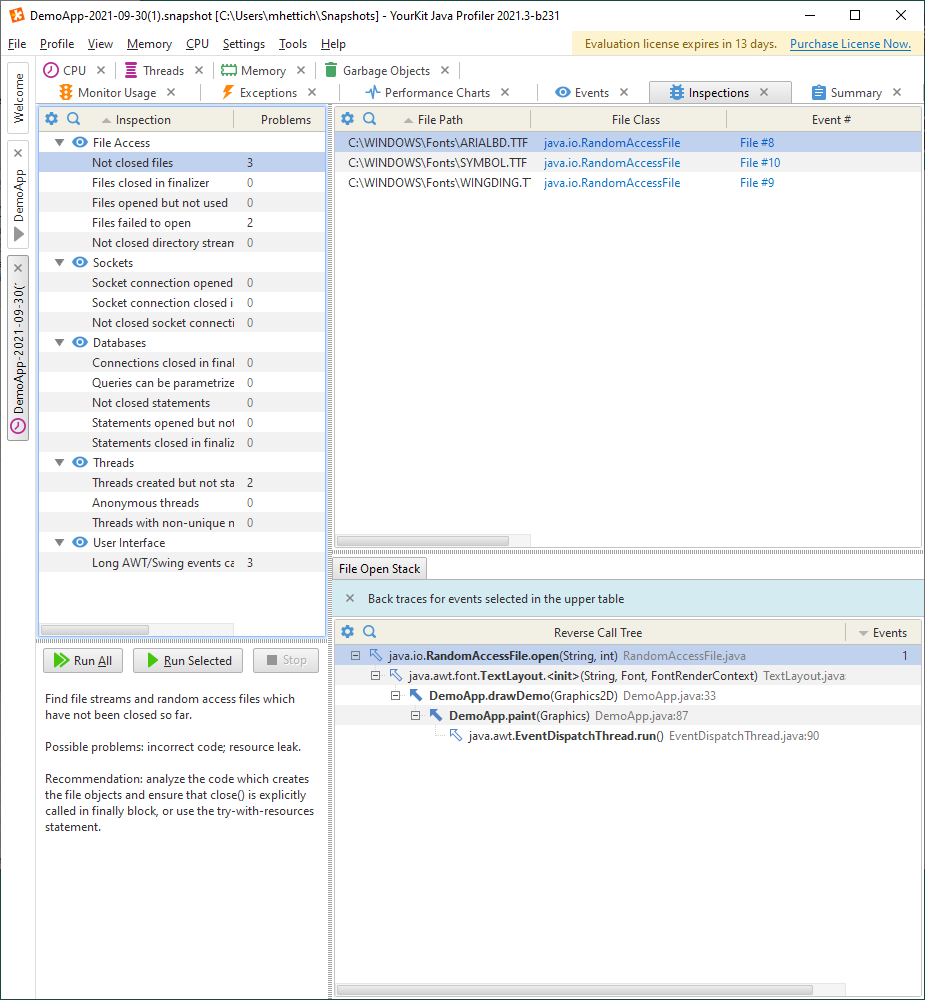
- Inspections: YourKit Java Profiler uses this function to draw attention to known problems. This allows you to find any problems without having to start a time-consuming manual evaluation.
- JFR event support: Newer versions also seem to support JFR events. The function was not yet available at the time of testing.
Contra:
- Nested, overloaded interface: It wasn't always easy for me to find the right place in the interface.
- Partly unintuitive: For example, the view menu was deactivated in a certain context and it was not clear to me why.
- Price: Due to the available (free) alternatives, I don't find the price particularly attractive. The free programs also do basic analyses such as CPU and memory relatively well.
Screenshots
Home page
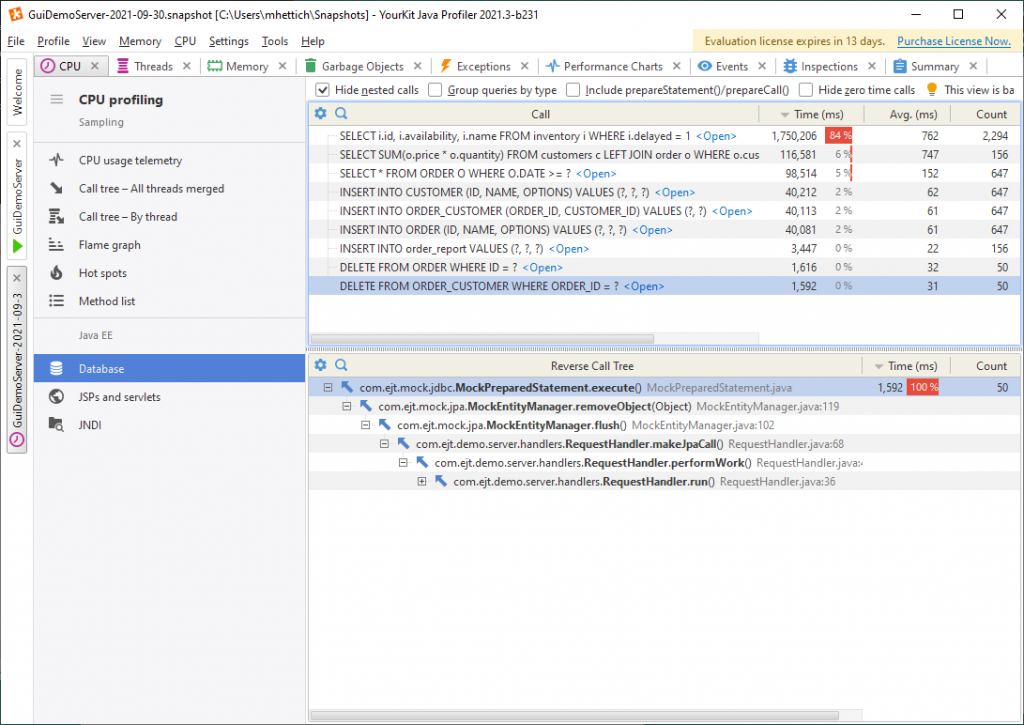
Database profiling
Inspections
Probes
Licenses
| Product | License | Price | Description |
|---|---|---|---|
| Java Mission Control | OpenSource | 0€ | Free of charge |
| VisualVM | OpenSource | 0€ | Free of charge |
| JProfiler | Single License | 420€ | One developer, multiple installations |
| JProfiler | Floating License | 1750€ | Multiple developers, one active instance |
| JProfiler | Trial | 0€ | Test for 10 days |
| YourKit Java Profiler | Single License | 459€ | One developer, one installation |
| YourKit Java Profiler | Floating License | 2299€ | Multiple developers, one active instance |
| YourKit Java Profiler | Trial | 0€ | Test for 15 days |
- There is a volume discount when purchasing multiple licenses
- Support sometimes costs extra
- Upgrades from previous versions are available at a discount
It is amazing that there are 4 really very good Java profilers, all of which leave a competent impression. It is also interesting that they are based on the various IDE platforms (Eclipse, Netbeans and IntelliJ). Thanks to an open source jolt in the Java world, two of the four tools are available free of charge. And this is also the crux of the matter in my view. The free programs are so good and solid that I am already very well equipped and future-proof for most tasks. The license models of the paid alternatives don't seem very attractive to me and are no longer up to date. Especially because I hardly noticed any really relevant advantages when trying them out. Only when it comes to higher level profiling do the commercial tools seem to me to be better positioned out-of-the-box.
